Power BI Company
REVES BI provides a comprehensive and user-friendly platform for data visualization, analysis, and collaboration.
Visualizing the Future: How to Derive Insights from Data
“Visualizing the Future” is the compass that guides your organization towards data-driven success. This process involves extracting profound insights from data, transforming it into a visionary roadmap for strategic decisions. It empowers your team to see beyond the present, anticipate trends, and craft a future where data is your most valuable asset. With this approach, you don’t just analyze data; you illuminate a path towards innovation, efficiency, and informed excellence.

Power BI Services
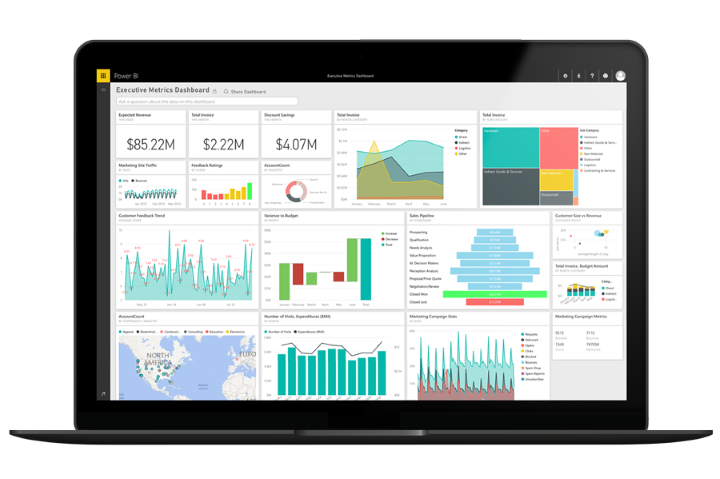
Interactive data visualization is where Power BI truly shines. Create stunning, interactive reports and dashboards that allow you to explore your data from every angle. Dive deep into your insights and gain a comprehensive understanding of your business.
Discover how Power BI can revolutionize your data analytics journey. Whether you’re a data professional or a business user, our platform empowers you to harness the full potential of your data, transforming it into actionable insights that drive success.
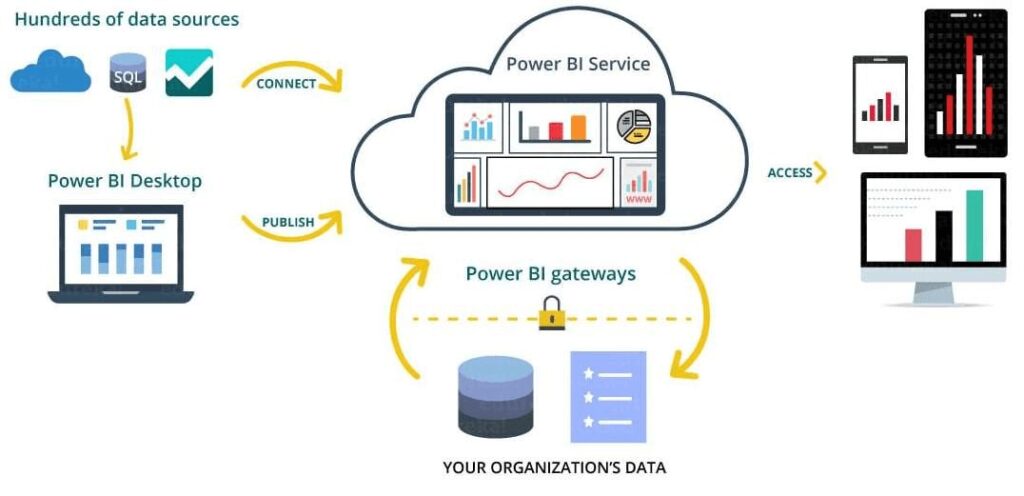
- Power BI Service
- Power BI Mobile Applications
- Power BI Report Server
- Power BI Desktop
- Others
- Power Pivot
- Power Query
- Power Map
- Power View
- Power Business Intelligence Q & A

Power BI Service: Unleash the Potential of Cloud-Based Data Insights
Power BI Service is the central pillar of the Power BI ecosystem. It empowers users to publish, share, and collaborate on interactive reports and dashboards in the cloud. With this cloud-based platform, your data becomes accessible from anywhere with an internet connection.
Power BI Mobile: Empowering Data Access on the Go
Take your data with you wherever you are with Power BI Mobile. With dedicated mobile applications available for various devices and platforms, you can access your reports and dashboards seamlessly. Stay connected to your data, explore insights, and share critical information with colleagues in real-time, whether you’re in a meeting, on a business trip, or away from your workstation. Power BI Mobile ensures data is at your fingertips, anytime and anywhere you need it.
Power BI Desktop: Unlocking Insights with Power BI
Power BI Desktop supports real-time data updates, making it a valuable asset for businesses seeking to make data-driven decisions and gain a competitive edge in today’s data-centric world. Whether you’re a data analyst, business analyst, or decision-maker, Power BI Desktop is an indispensable tool for turning data into actionable insights.
Data in Motion: Creating, Sharing, and Collaborating with Visualizations
Join us on a journey through the data lifecycle, from its creation as visualizations to its role in igniting collaboration and innovation within your organization

Data Preparation and Transformation:
This is where the journey begins—making your data shine. Power BI Data Preparation and Transformation is the backstage wizardry that cleans, organizes, and preps your data for its starring role. We ensure that your data is in top form, ready to illuminate insights and drive informed decisions with clarity and precision.
Data Modeling and Visualization
Picture it as the blueprint and the artwork of your data. Data Modeling and Visualization is the process of structuring and presenting your information in a way that’s not just informative but visually engaging. It’s about creating the framework that brings your data to life, making complex insights easily accessible and actionable. This step transforms data into a dynamic story that empowers decision-makers.
Advanced Analytics and Insights:
Advanced Analytics and Insights is the realm of cutting-edge techniques, forecasting, and uncovering hidden gems within your data. It’s about extracting valuable knowledge, revealing patterns, and predicting future trends. This step transforms your data into a strategic asset, providing you with a competitive edge and illuminating the path to informed decisions.
Publishing and Sharing Dashboards:
Publishing and Sharing Dashboards is the process of taking your beautifully crafted visualizations and making them accessible to the right audience. It’s about securely packaging and delivering actionable insights to decision-makers, whether they’re across the room or around the globe. This step ensures that your data-driven wisdom reaches those who need it, fostering informed collaboration and driving organizational success.

BENEFITS OF LEVERAGING POWER BI
- Easy Interaction with Existing Applications
- Customized Dashboards
- Advanced Analytics with R Integration
- No Storage or Performance Limits
- Securely published reports and many more
Location
USA | CANADA | INDIA
Call / Text
+1 778 4888228
India (24/7)
+91-72101-98172
India (24/7)
+91-93195-79996
EMAIL: RevesBi
Follow Us
Talk to Us!
We’d love to discuss your project or world-beating idea with you. Alternatively, send through a request for a quotation, enquiry.
A diverse range of clients
We cater to businesses of all sizes and industries, providing customized data science and analytics solutions. Our certified experts help you make data-driven decisions that drive growth and success.


